


Brief Takeaways:
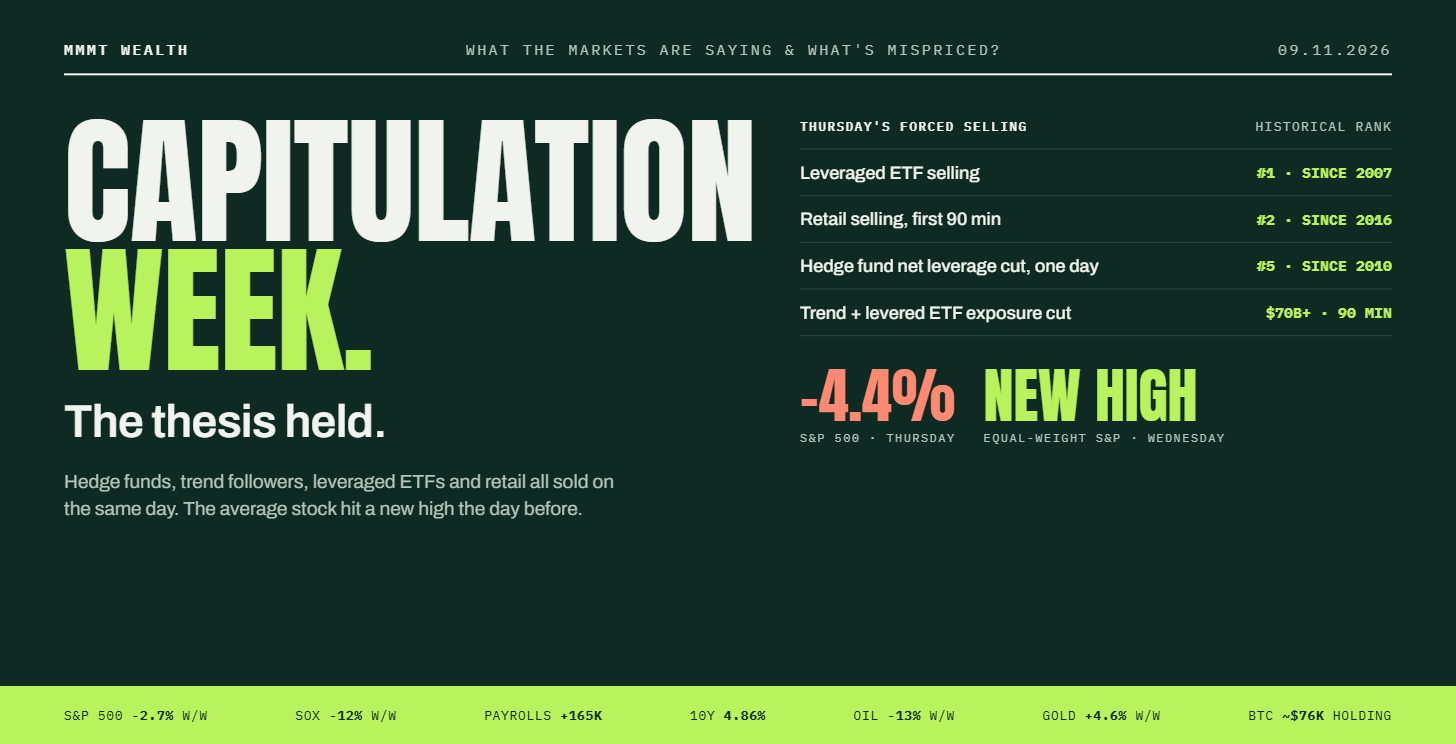
Last week looked like capitulation. Hedge funds, trend followers, leveraged ETFs and retail all sold at once on Thursday. The SPY had its worst day since April 2025…yet the equal-weight S&P hit a new all-time high just one day earlier.
The midterms added a legitimate new risk: local resistance to data centres. It’s real and worth watching how this plays out. But our opinion is that it slows the buildout rather than ending it and it makes the capacity already built and powered even more valuable.
The economy isn’t the problem. October payrolls came in at 165,000 against ~60,000 expected and unemployment fell to 4.1%. Meanwhile the 10-year yield fell and oil dropped ~13% on the week.
The miners are telling us something. Gold rose ~4.6% on the week, while silver and gold miners are holding up far better than the metals themselves. Divergences like this have historically shown up near bottoms.
I’m personally going to start building my positions again more aggressively. I can’t say whether the low is in, but I feel that we’re far closer to a bottom than a top. And this is a time to lower average costs considerably.
The Forced Sellers All Showed Up At Once
For four weeks I’ve said this was a hedge fund deleveraging and not an AI bubble bursting. Last week I said we were in the late innings.

And this week I think we’re in the even latter part of the innings.
This week delivered the kind of flush that tends to come at the end of those late innings.
Here’s what happened last week:
Tuesday: Democrats won control of both the House and the Senate.
Wednesday: The market initially loved it. The Dow had its best day since April 2025 (+1,500 points), Apple and Microsoft hit all-time highs, Amazon rose ~7% and oil fell ~8%. The equal-weight S&P 500 made a new all-time high.
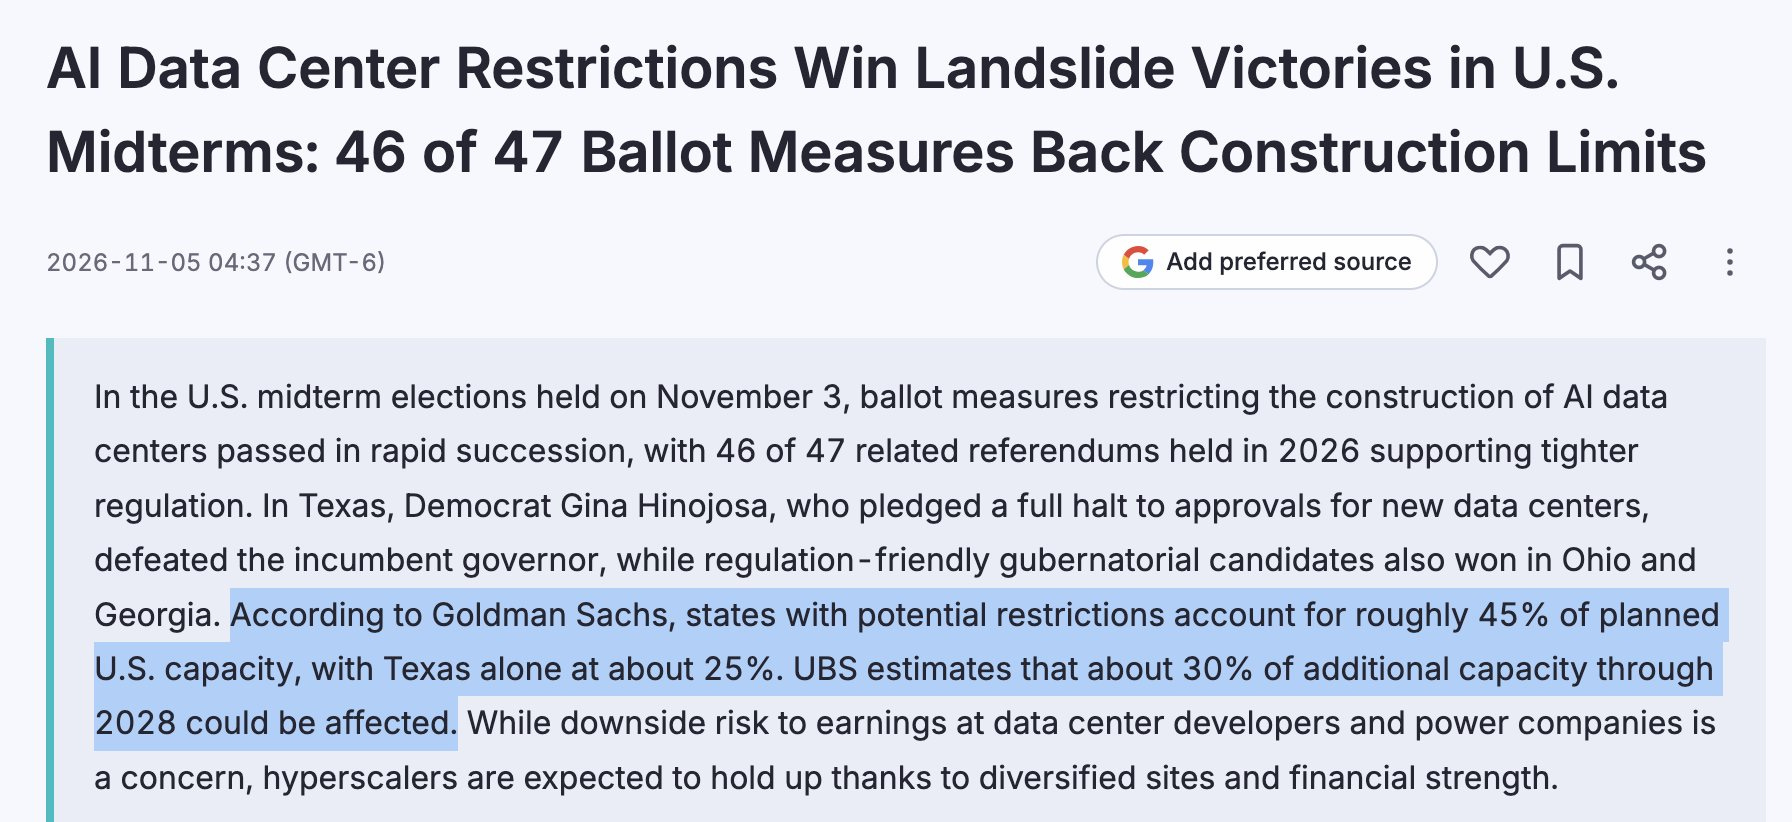
Thursday: The AI trade completely broke. Voters backed restrictions on data centres in most of the local ballot measures they faced and UBS estimated up to ~30% of planned US data centre additions for 2028 could be at risk from construction pauses. The S&P 500 fell 4.4%, its worst day since April 2025. Micron fell ~14% intraday, Nebius ~17% and CoreWeave over 12%.
Friday: Semis rebounded 4.2% and the Nasdaq rose 1.1%.
For the week, the S&P fell 2.7%, the Nasdaq 3.4% and the semiconductor index (SOX) ~12%. The S&P is now ~5.7% below its October high.
As I’ve said for the last 3 weeks during retail panic, it’s important to use some logic here. Look at who the main sellers were:
Hedge funds: US long/short hedge funds cut their net leverage by ~5% in a single day. Per Morgan Stanley, that’s the fifth-largest one-day cut since 2010.
Trend followers and leveraged ETFs: JPMorgan estimates they cut more than $70B of equity exposure within 90 minutes of the open on Thursday. Leveraged ETFs had their largest selling on record in data going back to 2007.
Retail: Retail selling in the first 90 minutes was the second-largest since 2016.
Panic gauges: The one-day jump in the VIX was one of the largest of the last 25 years and the put/call ratio hit its highest level since March.
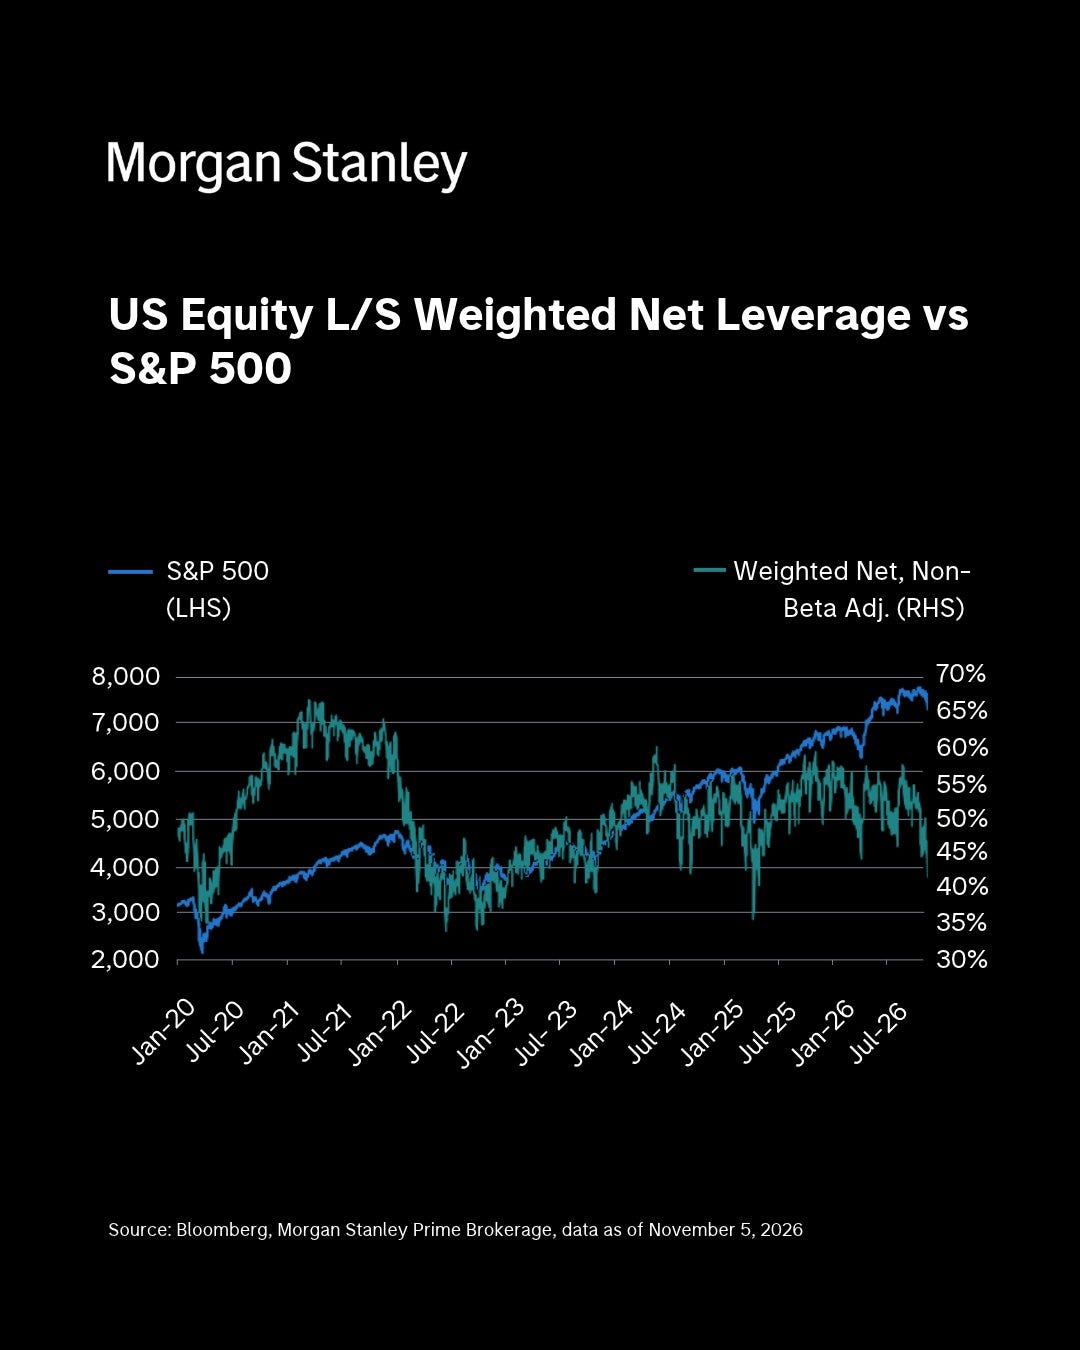
This is all synonymous with forced selling…not a slow loss of conviction in the AI trade.
Forced selling happens when investors have to sell because of margin calls, risk limits or rules, not because they’ve changed their minds about what they own. Thursday was full of it.
Look at what didn’t break (as opposed to what did break):
The equal-weight S&P 500 made a new all-time high on Wednesday. The average stock is doing fine.
The hyperscalers, the companies actually paying for AI, ended the week higher (aside from META which ended down -0.8%).
Credit didn’t follow equities. Investment-grade credit didn’t take out its October highs, leveraged loans rallied hard and European banks had their best week since June. If this were a genuine credit event these would be the first places to crack. That’s not happening.
Why I Think We’re Nearing a Bottom (Technicals)
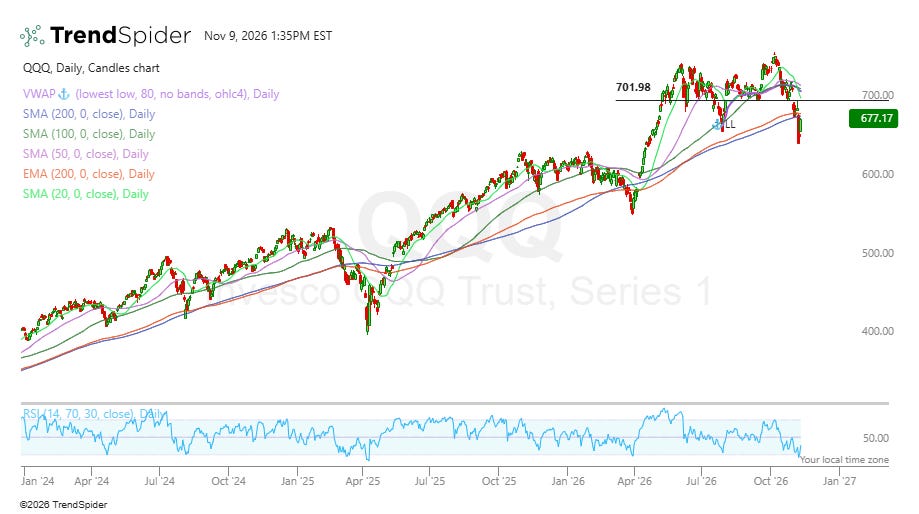
Sometimes it can be extremely simple.
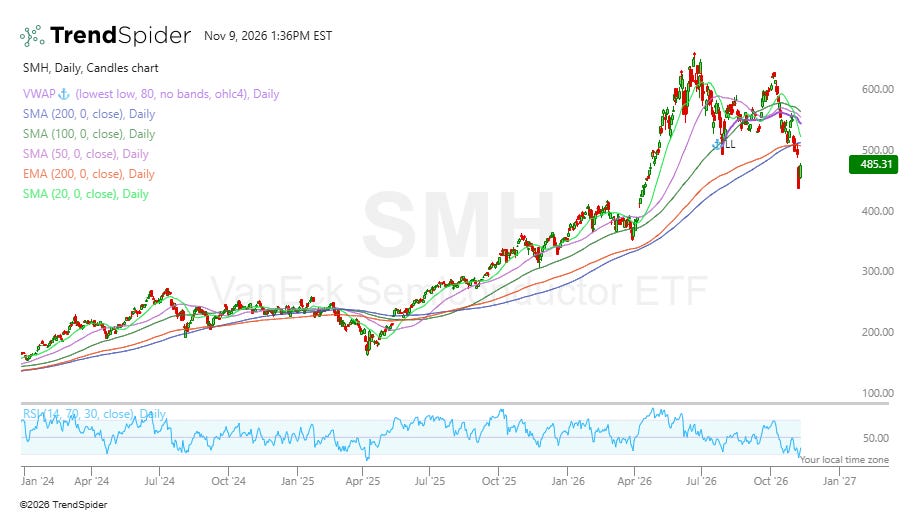
One way to look at this is the 200D moving average. A lot of the VanEck Semiconductor ETF constituents (including the ETF itself) have traded well above the 200D moving average since May 2025.
At some point everything reverts to its mean either by prices falling, or by prices consolidating for a long enough time for the moving average to catch up.
SMH traded ~64% above its moving average back in June and now we trade ~9% below the moving average.
Data Centre Restrictions
Data centre restrictions is one of the legitimate risks that were added to the equation over the last week. It’s certainly a headwind and will add some friction to the speed of the AI buildout but I strongly believe this will not materially slow it down.
Because ultimately it all comes down to these three things:
It changes where data centres get built…not whether they get built. Demand for compute still far exceeds supply and projects will shift to friendlier states and overseas where the buildout was already accelerating.
It makes existing capacity more valuable. If new supply gets harder to build, the data centres already built, powered and leased get more pricing power, not less. That’s bullish for compute prices which were already rising.
The uncertainty is now known. The market has worried about how politics might turn against the AI infrastructure trade and it’s been quietly pricing that in over the last few months. It now has more certainty and the market prices known risks far better than unknown ones.
Rotation, Not Recession
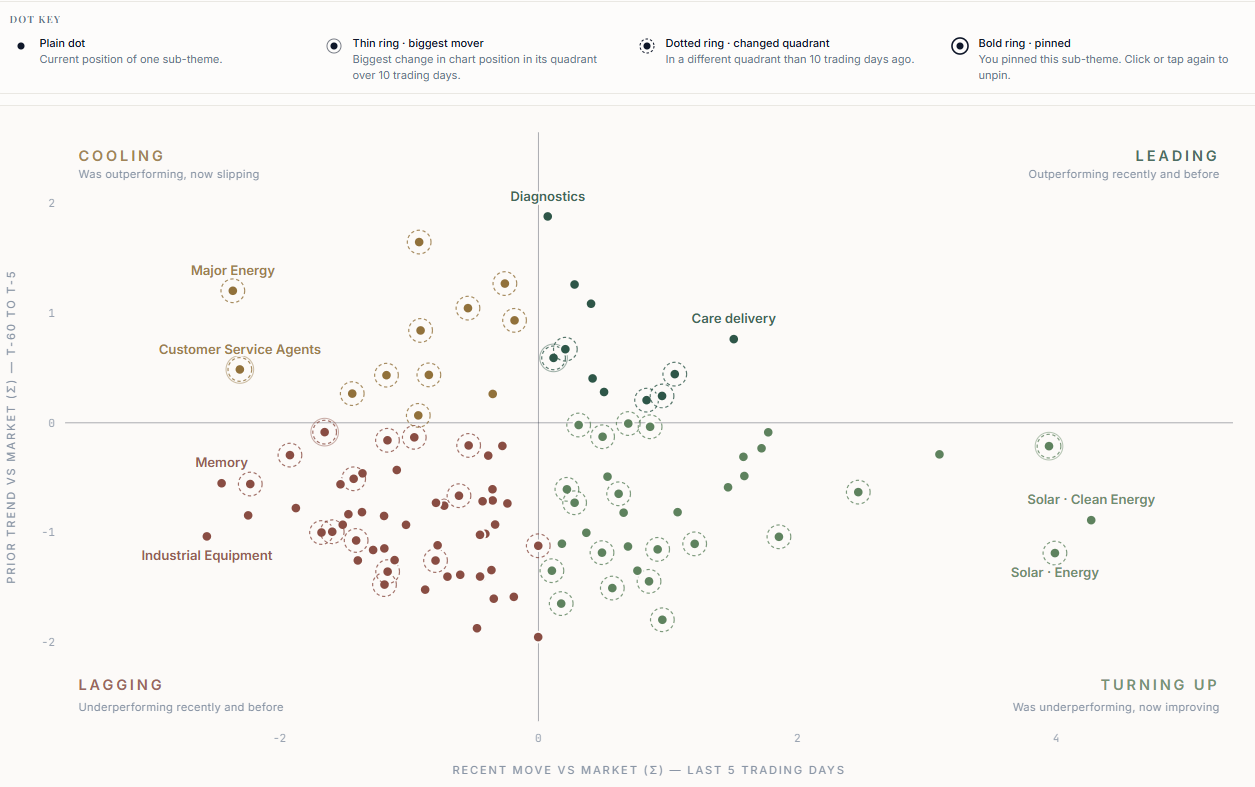
One of the most interesting charts right now is the equal-weight S&P 500 against the regular S&P 500. It’s breaking out of a year-long base. Value stocks are also starting to outperform growth stocks for the first time in years.
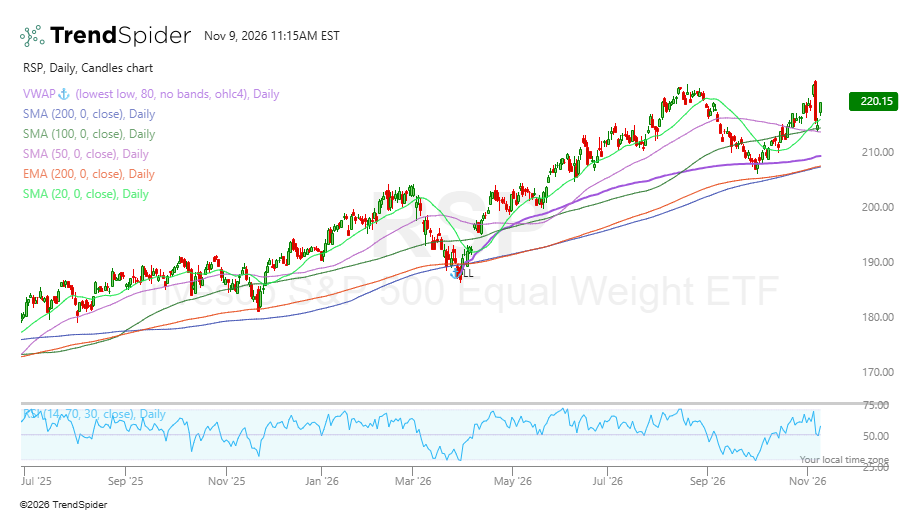
Some may read that as the end of tech leadership. I read it as broadening which is healthy.
Money isn’t leaving the market at all. It’s just spreading out.
The average company is growing earnings, hiring and benefiting from the AI spend flowing through the economy. That’s the exact opposite of what you see heading into a recession when the average stocks fall first.
Economic data backs up the health of the economy. October payrolls came in at 165,000 (versus ~60,000 expected) and unemployment fell to 4.1%. Whilst headlines continue to suggest the economy is struggling, almost all real data suggests otherwise.
A broader market with a healthy economy underneath is a much stronger foundation than one carried by a handful of AI names.
The AI trade will likely recover from here without needing to carry the whole index on its own.
Macro Update
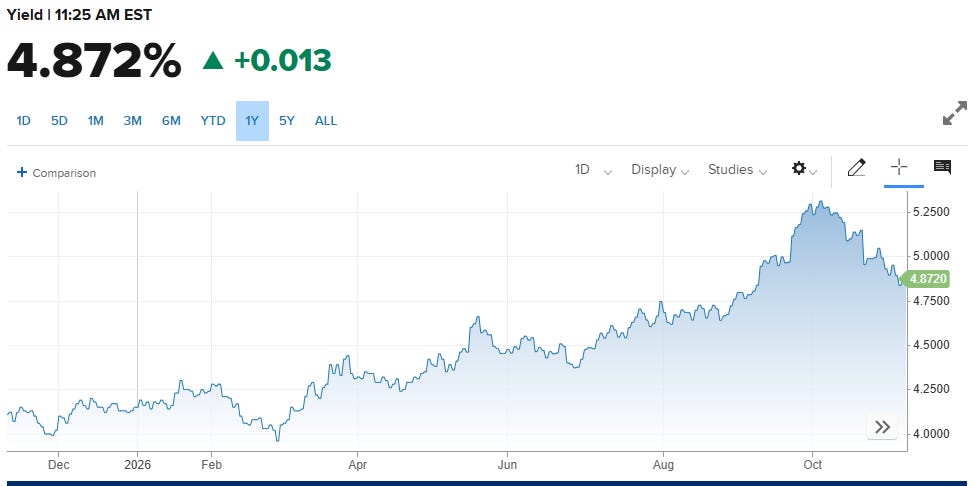
Yields keep falling. The 10-year closed the week at ~4.86%, down from ~5.05% at the end of October. It fell despite a strong jobs report, which tells you the bond market isn’t worried about the economy overheating.
NVDA’s Jensen Huang admitted to an affair with a woman deemed to be associated with Chinese intelligence which has led to an official investigation by the NVDA board. The stock is currently down 5% on Monday morning at the time of writing this. Until there is any evidence whatsoever that Jensen has lobbied the U.S. government to loosen chip export controls via this Chinese spy…this is less of an issue than many are making it out to be.
Inflation is easing. Oil fell ~13% last week and is down another 3% today (Monday).
CPI on Tuesday (10 November) is the big one. Markets still price a high chance of a December rate hike so a soft print could take a lot of pressure off. A hot one would extend the volatility.
The Anthropic IPO is coming but at a much lower price. Valuation has slipped from ~$1.5T to ~$1.2-1.3T after this week’s sell-off. The business is the same one that showed $16.3B of H1 revenue last week. Only the price investors are willing to pay has changed which is what a positioning flush looks like.
Commodities
We remain bullish on copper, solar, scandium and precious metals.
Gold rose ~4.6% last to ~$4,080, while silver, platinum and palladium all had strong weeks. Falling yields, falling oil and easing rate-hike fears all help the metals.
And Monday so far has been a strong day for copper and silver in particular.
More importantly for my current portfolio:
Silver miners are beating silver. Silver currently sits at $52.67 on Monday but more importantly silver miners have outperformed silver bullion by ~58% since January’s top. Miners usually lead the metal both on the way down and on the way up.
Gold miners are beating gold. Gold made a new correction low on 30 October, but the gold miners (GDX) were still ~10% above their July low. Relative to gold, the miners are near their highest level in more than a decade.
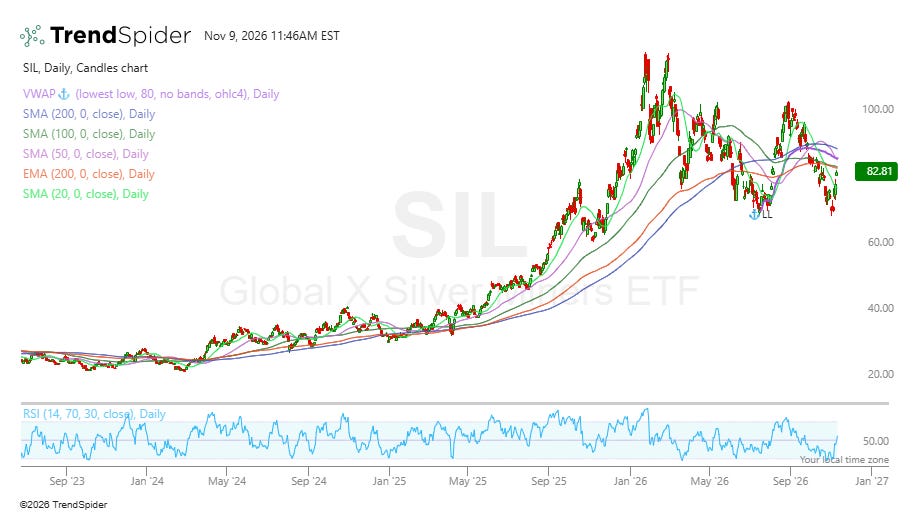
When the miners hold up this well while the metal itself makes new lows, it has historically pointed to a bottom forming in the metal.
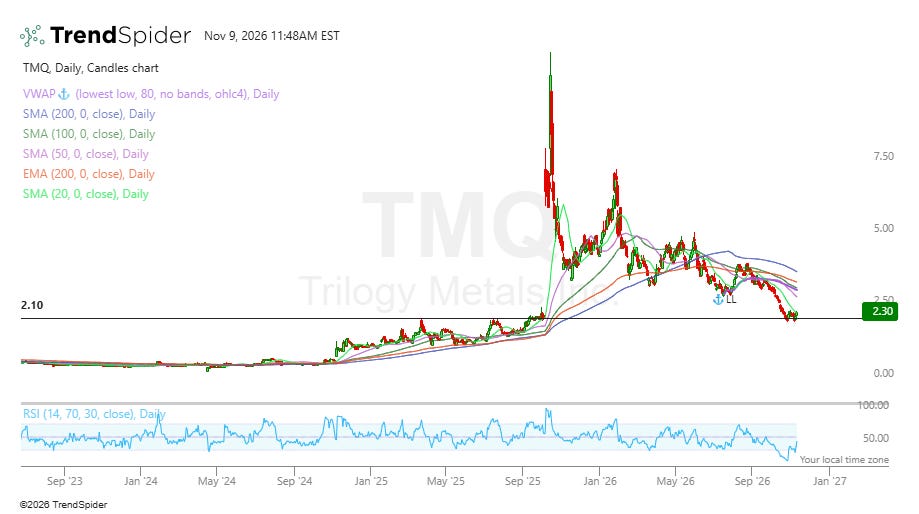
Copper: No change to our view. Chile’s production cuts and record Chinese import premiums from last week still stand this week. Supply is going backwards while AI and grid demand keeps rising.
I remain bullish copper with positions still in COPX and TMQ.
Crypto
Bitcoin fell ~2% this week and is holding ~$76K which is a pretty quiet week considering what happened in the equities market.
BTC continues to hold its key support zone around $75-76K and remains above its 200-day moving average. While the AI trade fell ~12%…Bitcoin barely moved.
The bigger picture matters more. Much of what has held BTC back this year has been the same things that held back silver and gold: rising real yields, high oil, rate-hike fears and capital being pulled into the AI buildout. If those pressures have peaked, which this week’s moves in yields and oil suggest, Bitcoin is one of the assets best positioned to benefit.
Tokenization news continues to advance as well.
What’s Mispriced?
This is a section looking at the potential opportunities I’m seeing at the moment. I’ll split them by how I see the risk profile (high risk → low risk).
I aim for at least 3+ opportunities in every article I publish here but that depends on what the market is offering at the time of writing.
You’ll also likely see overlap week to week. I am not a trader that changes his mind every few hours, days, or even weeks. If I see an opportunity, that opportunity often stays around for weeks/months/years.
Last week we touched on:
Applied Optoelectronics (AAOI)
Marvell (MRVL)
Aeva Technologies (AEVA)
Applied Optoelectronics | AAOI - MEDIUM RISK
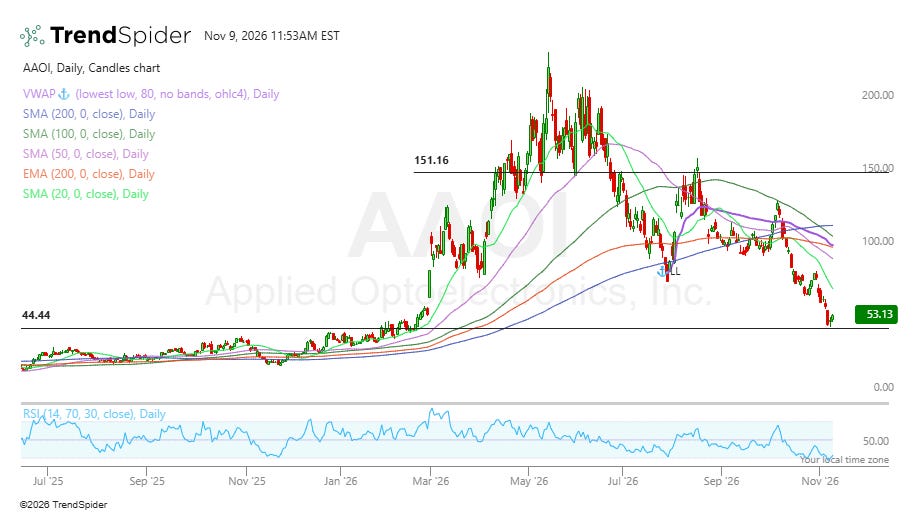
AAOI reported earnings last week of which most of it was bullish…aside from news that the buildout has been delayed and goals which were originally set for H1 2027 have now been pushed back to H2 2027.
In terms of a delay of 4-6 months…that doesn’t matter to me. I’ve ran the numbers prior to this with 1-2 year delays and with the buildout only reaching ~70% of management’s forecasts and I still feel the risk to reward were in the buyers favour.
I’ve now also updated my model on the website.
The main issue is trust in management. One of the worst things a management team can do is overpromise and underdeliver. It puts every forecast under much more scrutiny and risking factors on models just have to be increased.
You can see my model online but my current forecasts are:
2027: I forecast $4B in revenue.
2028: I forecast $6.3B in revenue ($471M / month in transceiver revenue).
2029: I forecast $7.3B in revenue.
Net income I forecast 17.5% so at $7.3B in revenue * 17.5% we have $1.28B in net income.
I’m working from 110M share count which I see as conservative which then gives us a $11.62 EPS in 2029.
At a 18x multiple this gives us a $210 share price.
I remain long AAOI and the closer I can get my average cost to ~$80 ish the more I will.
